Chemical & Radiation Poisoning at Ground Zero – Wuhan, China & New York City, New York
Updated: Sep 25, 2023
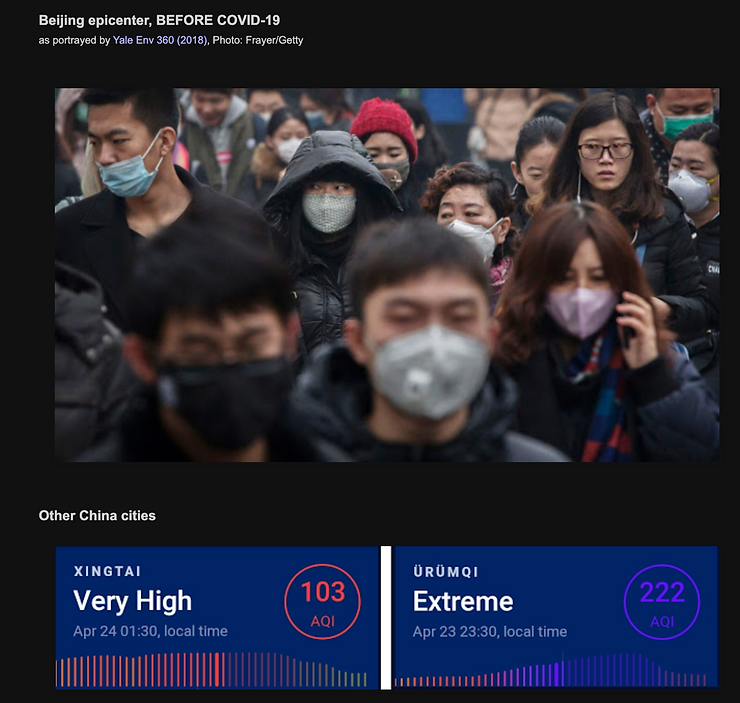
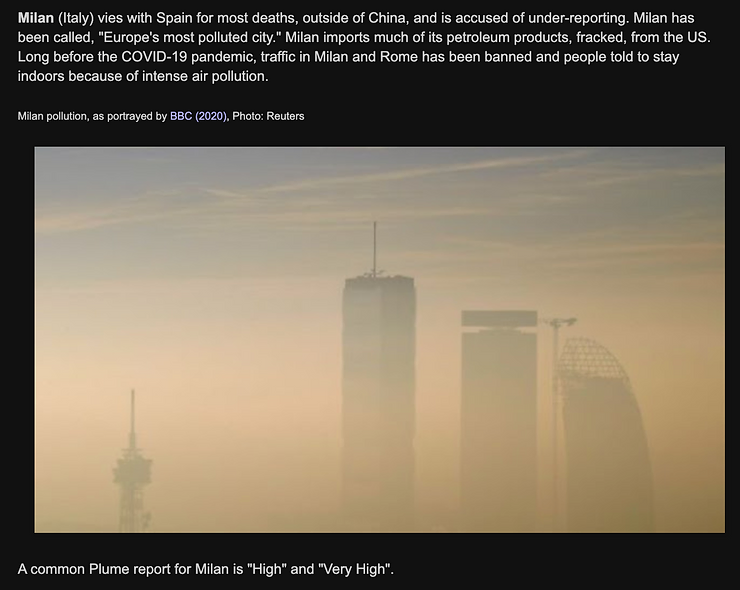
Wuhan, China – One of Many Epicenters of the Pandemic [1-82]
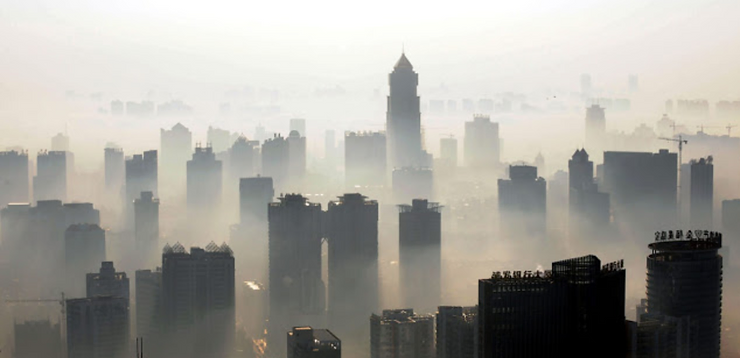
Air Pollution – A Primary Causation for the Symptoms of SARS – CORONAVIRUS 2 and 19
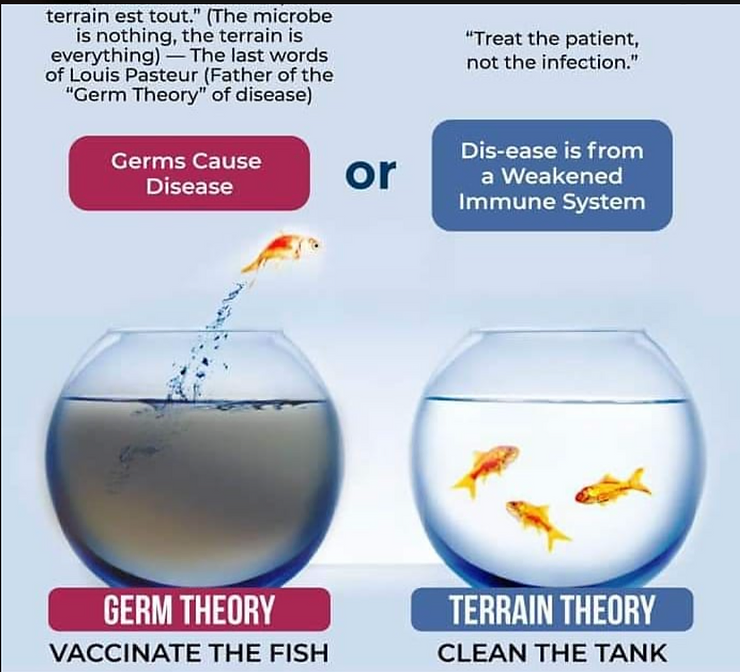
“Coronavirus is an invisible phantom so-called virus and therefore NOT contagious/infectious making vaccination totally useless and a contributing factor for chemical and biological poisoning!” Dr. Robert O Young
Many studies find that air pollution is the primary co-factor associated with the coronavirus. Research scientists stay politically safe by avoiding the short-term environmental acid air pollution trigger (short-term air pollution). They use the terms: “virus”, “co-factor”, and “long-term air pollution”.[1 – 13]
There are thirty-four epicenters listed below, sorted by death incidence. The table reveals that COVID-19 death incidence is proportional to the presence of fracking exhaust and an acidic poisoned earth plume. The major epicenters for acidic poisoning are at the top: Wuhan, China and the Tri-State Region (NY/NJ/CT), Louisiana, etc
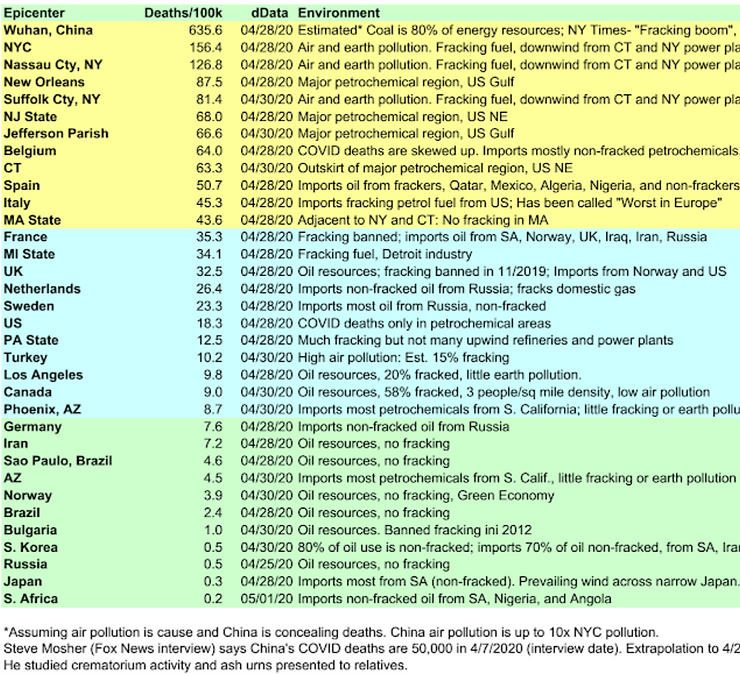
All sides agree that long-term air pollution poisoning that leads to hypoxia and pathological blood coagulation is a constant background stressor and a major contributor to acidic poisoning of the epicenters population. I have suggested that we need to set aside and dismantle the viral paradigm and adopt the terrain or environmental causation theory which can then be studied deeper for all acidic contributing factors that lead to the symptoms associated with the underlying causes.
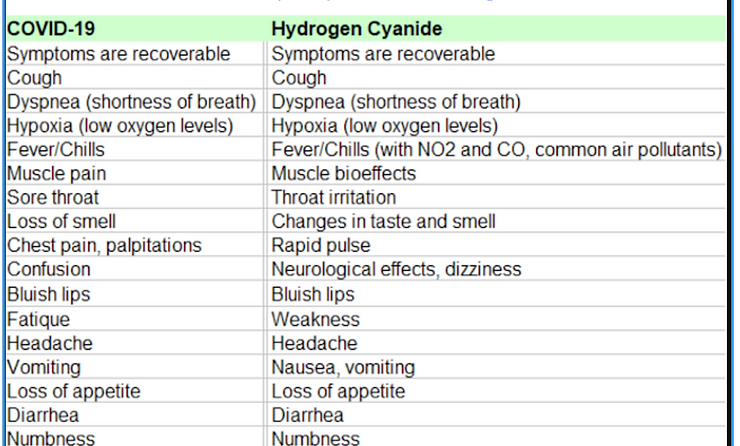
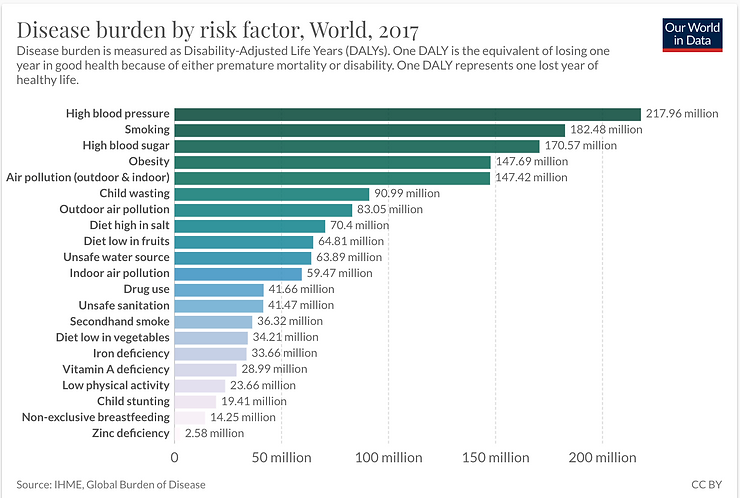
A recent Harvard study finds that those vulnerable to the symptoms of the so-called “virus” are generated by long-term chemical poisoning from air pollution. A small increase in long-term exposure to PM2.5 leads to a large increase in the symptoms and death rate claimed to be caused by the phantom virus, COVID-19 … 1 μg/m3 in PM2.5 of hydrogen cyanide air pollution poisoning is associated with an 8% increase in the COVID-19 death rate. Once again, the increase in the COVID-19 death rate is due to chemical poisoning from air pollution and NOT from an invisible phantom virus. As you can see in the chart below hydrogen cyanide poisoning and its symptoms are identical to those claimed as an infectious virus now known as COVID-19 which has never been scientifically identified, isolated and cultured under Koch’s postulates, validating its existence of so-called virus. [14]
A study from Tel Aviv University, describes the long-term NO2 or nitrogen dioxide air pollution poisoning component as a “most important contributor” to the COVID-19 pandemic. Once again, showing that the invisible phantom virus is NOT the cause of the symptoms listed above but are the result of acidic air pollution and earth plumes.
[NO2 (Nitrogen dioxide)] is one of the most obvious contributors to fatality caused by the COVID-19 virus in these regions and maybe across the whole world. [15]
Are Large Populations a Contributing Factor or Risk for Viral Infection
Air pollution has already been acknowledged by many researchers as a major cofactor for COVID-19 dis-ease. It has been suggested by some scientists that incidences are high in NYC because of the higher population density, and thus, social distancing of six feet, when not maintained will lead to more cases of COVID-19 infections..
A comparison of the five NYC boroughs refutes this theory of population density and therefore social distancing is NOT a common denominator in the increased infections. The boroughs listed below are all within a small geographical area, sharing a common environment in terms of above-ground and therefore subjected to acidic air pollution and earth plume poisoning.
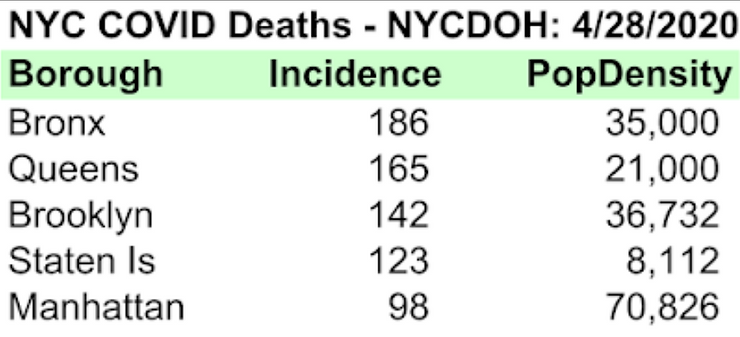
It is important to note that Manhattan has the highest population density with the lowest incidence of the so-called phantom COVID-19 viral infections. The Bronx has half the population density of Manhattan with nearly twice the incidences.
It is also very important to point out that Manhattan has more people located on higher floors, away from earth pollution poisoning and earth plumes whereas the Bronx has more people located on lower floors near earth plume pollution. Finally, the Bronx is nearer to the newly installed upwind electric power plants which emits excessive amounts of air and electromagnetic pollution.
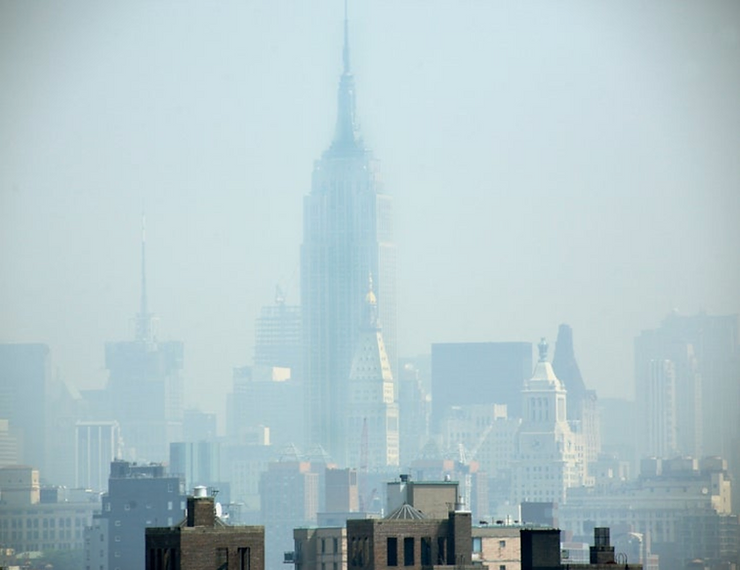
New York City – A City of Toxic Air Pollution and Earth Plumes
Metaphorically speaking, New York City is a petri dish of people who are vulnerable for being poisoned to death by the application of a dye of toxic fracked-fuel exhaust and NOT some invisible phantom. This is revealed in terms of their morbidity and mortality when looking at incidences and not cases determined by inconclusive and vague antibody or RTPCR testing..
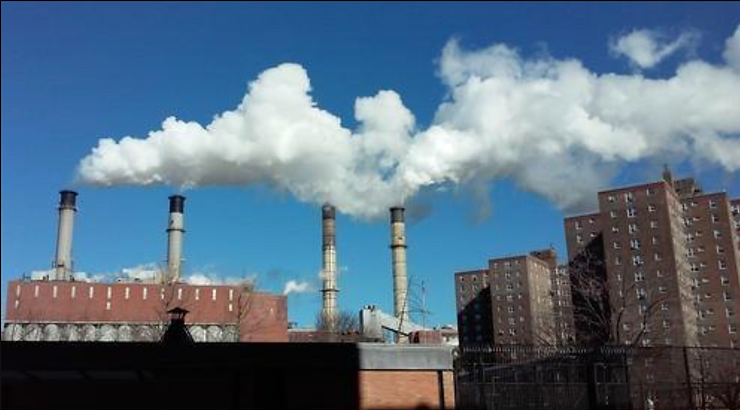
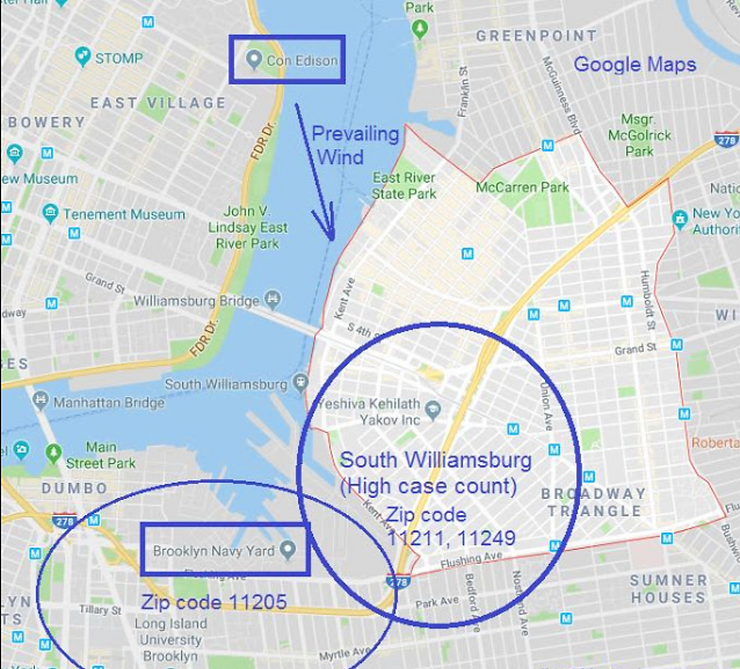
The four low stacks of the 14th Street Con Edison electric power plant (Manhattan) are across the East River and directly upwind from the Williamsburg epicenter. A few parts-per-million (ppm) chronic exposure to its exhaust components, such as Nitrogen dioxide and Hydrogen cyanide, can cause a wide variety of debilitating acidic symptoms, having nothing to do with a fake virus. “Beyond My Ken” [CC BY-SA 4.0)
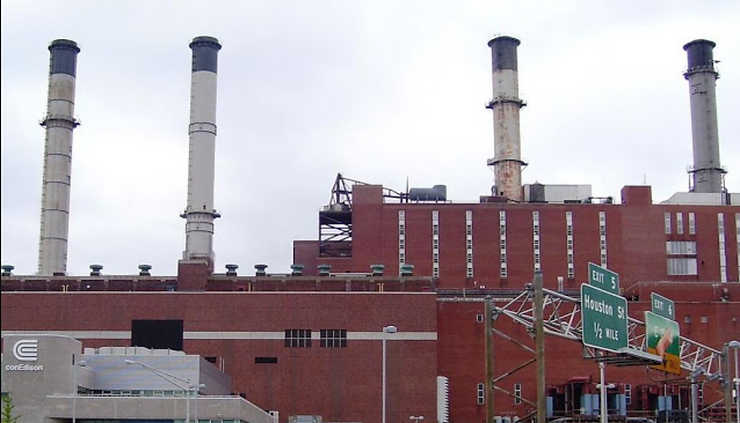
Children and the elderly are the most vulnerable to acidic poisonous air pollution and earth plumes because children are still developing their immune systems and the elderly generally have compromised immune systems due to pre-existing conditions. “I was told by DOH officials that inspectors will NOT approve commercial day care permits near this power plant because it would be considered “co-located” and therefore “a condition that may expose children to environmental hazards”-Juan Pagán, Assembly Candidate
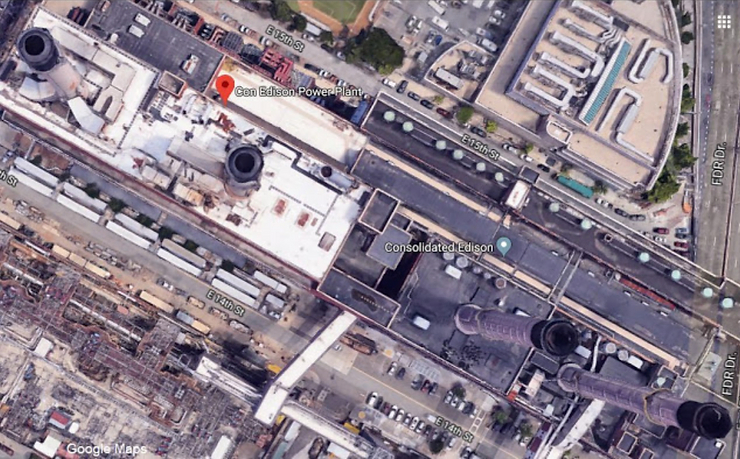
Aerial View of Con Edison or CONVID Edison
The four stacks of toxic acidic poisonous exhaust from the CONVID Edison power plant is rated at 736 megawatts. This approximates 85,000 carbon monoxide polluting automobiles cruising at 40 mph setting the stage for toxic acidic air pollution leading to the symptoms associated with the fake virus called COVID-19.
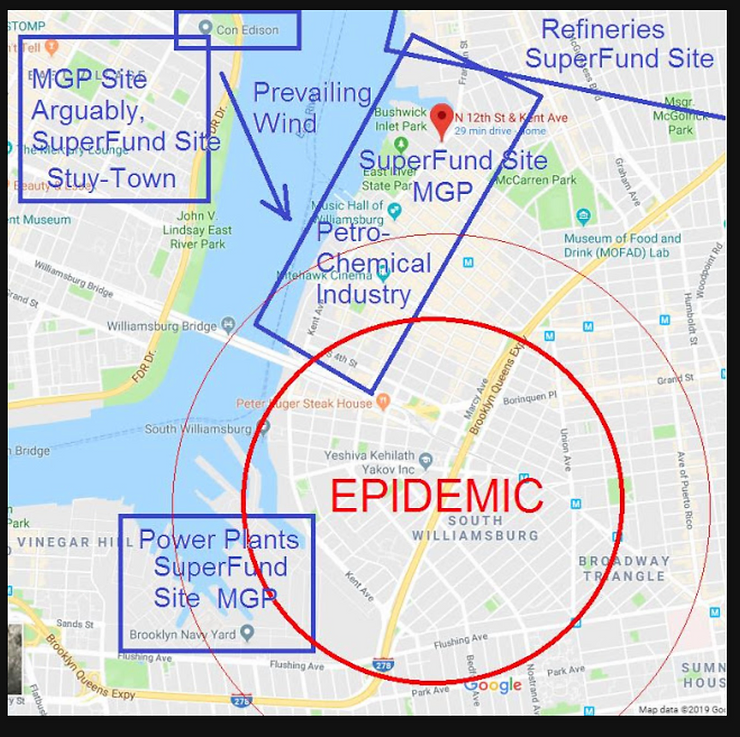
The following map shows the main epicenter of air pollution to the right circled (zip codes 11249, 11211), and a lesser epicenter of air pollution to the left circled (zip code 11205), both Williamsburg zip codes, where emergency vaccines and fines are mandated and a contributing factor to decompensated acidosis of the interstitial fluids of the Interstitium. Blue squares designate the location of the toxic acidic power plants.
Toxic Acidic Air Pollution and Earth Plumes are the Cause and NOT an Invisible Phantom Virus! No Need to Social Distance!
Canadian epicenters provide another contradiction for those who believe population density supports the infectious disease paradigm. Vancouver, with the highest population density has very low COVID-19 incidence. North Montreal, with its lower population density, has the highest incidence of COVID-19 incidences. The difference between Vancouver and North Montreal is North Montreal is an environmental air pollution disaster, with many oil refineries nearby creating toxic acidic air pollution. No so-called infectious disease causing virus can be found but increased levels of Nitrogen Dioxide and Hydrogen Cyanide is found.
The distinguished medical scientist, Sucharit Bhakdi, states that viral causation is dubious, the common denominator is “horrid air pollution”[16] and the medical response to the pandemic is “grotesque, absurd and very dangerous.”[94,95]

Dr. Deborah Birx, while representing the Federal Administration, inadvertently stated that deaths and disease are diagnosed as COVID-19 largely by mere association with a positive test result. That is knowing that the RTPCR testing is NOT disease specific and only tests antibodies which could be elevated for multiple reasons.
Representing COVID-19 largely by mere association with a positive antibody test as a “Case” is misleading, because cases are not well defined. A mere positive for an already ill person is NOT enough for a COVID-19 diagnosis. “Death” is more accurate, because death is more likely to be associated with definitive symptoms like a high fever or lung damage.
Cases and deaths are misleading, for example: NY Times, “Morning Briefing” (4/23/2020):
…the US outbreak… by far the world’s largest…
All public information outlets should be using the word “incidence”.
Incidence reveals disease intensity, disease per population. It reveals patterns that point to toxic acidic chemical and/or radiation poisoning sources. For example, fracked fuel exhaust of nitrogen oxide or hydrogen cyanide poisoning correlates with deaths and deaths from chemical poisoning are incidences.
Incidences vs Cases
The US may have “the largest” numbers of so-called coronavirus cases (outside of China), but would be further down the list in terms of incidences. If US refinery epicenters were subtracted out of the cases, US incidences would be “the smallest” in the World.
New York City’s so-called coronavirus incidences is much higher than US incidence. Therefore, what is different about New York City?
MASSIVE ACIDIC EARTH & AIR POLLUTION!
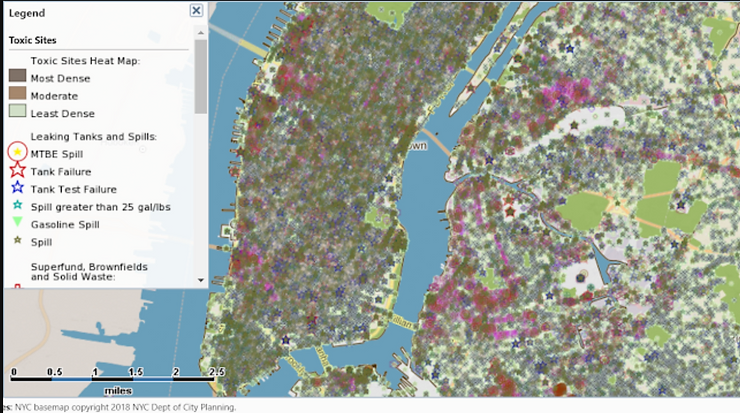
The above map is a great contribution in support of death by acidic chemical and radioactive poisoning and NOT from a phantom virus called Coronavirus COVID-19. Maps of disease incidence are the best indicators of acidic chemical and radiation pollution, and for that reason, the NYC Departments of Health is not allowed to provide detailed epidemiological maps. They, however, state that the reason is patient privacy. But such data could be omitted or anonymized for the purposes of determining the actual number of incidences caused by acidic chemical and radiation poisoning or from the phantom Coronavirus COVID-19.
Even in the mainstream, the fake virus and infectious-believing World, a “case” is not necessarily the disease, and any COVID-19 disease is not necessarily due to the CORONAVIRUS-COVID-19!

Conclusion
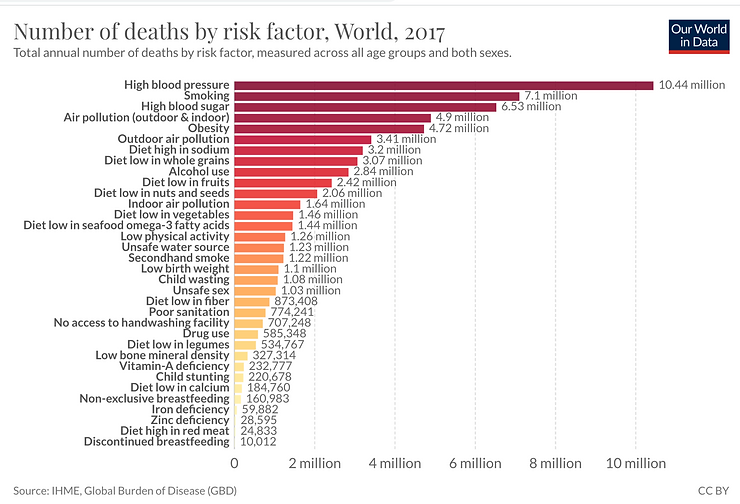
ACIDIC toxic air pollution or ‘Acid Rain’ contributes to 9% of all deaths globally – this varies from 2% to 15% by country compared to the so-called phantom Coronavirus, CONVID-19 of .02% to .05% which is caused by chemical and radiation poisoning.
The REAL PANDEMIC BASED ON INCIDENCES!
Thus, the advertised and media marketed plandemic is, to an unknown degree, a fraudemic of testing. Yet, from the standpoint of the chemical and radiation acidic poisoning thesis, there is a real acidic chemical and radiation pollution pandemic, of which the test(s) would be measuring residual biological matter (fragmented genetic matter) caused by radioactive and chemical exposure and an activated immune response (falsely interpreted as COVID-19 antibodies)!
In other words, real scientific evidence that can be quantified and then analyzed and does NOT require YOU to exercise your faith to believe in a phantom virus called COVID-19 – based upon a fake science called virology which only exists as a concept on a piece of paper! [96][97][98][99][100][101]
Hopefully, it is NOW clearer to you that the purpose for the Coronavirus CONVID-19 Plandemic is NOT about Public Health! So what is it about? What do YOU Think! Power? Money? Population Control?

References
Coronavirus Plandemic
[1] Cadotte, Marc. “Early Evidence That COVID-19 Government Policies Reduce Urban Air Pollution,” March 30, 2020. https://doi.org/10.31223/osf.io/nhgj3.
[2] Conticini, Edoardo, Bruno Frediani, and Dario Caro. “Can Atmospheric Pollution Be Considered a Co-Factor in Extremely High Level of SARS-CoV-2 Lethality in Northern Italy?” Environmental Pollution, April 4, 2020, 114465. https://doi.org/10.1016/j.envpol.2020.114465.
[3] “Evaluation of the Potential Relationship between Particulate Matter (PM) Pollution and COVID-19 Infection Spread in Italy.” Accessed May 3, 2020. https://www.guapo-air.org/sites/default/files/2020-03/Evaluation%20of%20the%20potential%20relationship%20between%20Particulate%20Matter%20%28PM%29%20pollution%20and%20COVID-19%20infection%20spread%20in%20Italy.pdf.
[4] “Exposure to Air Pollution and COVID-19 Mortality in the United States: A Nationwide Cross-Sectional Study | MedRxiv.” Accessed May 3, 2020. https://www.medrxiv.org/content/10.1101/2020.04.05.20054502v2.
[5] Ficetola, Gentile Francesco, and Diego Rubolini. “Climate Affects Global Patterns of COVID-19 Early Outbreak Dynamics.” MedRxiv, April 20, 2020, 2020.03.23.20040501. https://doi.org/10.1101/2020.03.23.20040501.
[6] Ma, Yueling, Yadong Zhao, Jiangtao Liu, Xiaotao He, Bo Wang, Shihua Fu, Jun Yan, Jingping Niu, Ji Zhou, and Bin Luo. “Effects of Temperature Variation and Humidity on the Death of COVID-19 in Wuhan, China.” Science of The Total Environment 724 (July 1, 2020): 138226. https://doi.org/10.1016/j.scitotenv.2020.138226.
[7] Martelletti, Luigi, and Paolo Martelletti. “Air Pollution and the Novel Covid-19 Disease: A Putative Disease Risk Factor.” Sn Comprehensive Clinical Medicine, April 15, 2020, 1–5. https://doi.org/10.1007/s42399-020-00274-4.
[8] Natale, Giuseppe De, Valerio Ricciardi, Gabriele De Luca, Dario De Natale, Giovanni Di Meglio, Antonio Ferragamo, Vito Marchitelli, et al. “The Covid-19 Infection in Italy: A Statistical Study of an Abnormally Severe Disease,” April 6, 2020. https://doi.org/10.20944/preprints202004.0049.v1.
[9] “Pansini and Fornacca – 2020 – Initial Evidence of Higher Morbidity and Mortality.Pdf.” Accessed May 3, 2020. https://www.medrxiv.org/content/10.1101/2020.04.04.20053595v2.full.pdf.
[10] Pansini, Riccardo, and Davide Fornacca. “Initial Evidence of Higher Morbidity and Mortality Due to SARS-CoV-2 in Regions with Lower Air Quality.” Preprint. Epidemiology, April 7, 2020. https://doi.org/10.1101/2020.04.04.20053595.
[11] Sasidharan, Manu, Ajit Singh, Mehran Eskandari Torbaghan, and Ajith Kumar Parlikad. “A Vulnerability-Based Approach to Human-Mobility Reduction for Countering COVID-19 Transmission in London While Considering Local Air Quality.” MedRxiv, April 17, 2020, 2020.04.13.20060798. https://doi.org/10.1101/2020.04.13.20060798.
[12] Travaglio, Marco, Yizhou Yu, Rebeka Popovic, Nuno Santos Leal, and L. Miguel Martins. “Links between Air Pollution and COVID-19 in England.” MedRxiv, April 28, 2020, 2020.04.16.20067405. https://doi.org/10.1101/2020.04.16.20067405.
[13] Wang, Pengfei, Kaiyu Chen, Shengqiang Zhu, Peng Wang, and Hongliang Zhang. “Severe Air Pollution Events Not Avoided by Reduced Anthropogenic Activities during COVID-19 Outbreak.” Resources, Conservation and Recycling 158 (July 1, 2020): 104814. https://doi.org/10.1016/j.resconrec.2020.104814.
Epicenters
[17] “15 Cities with the Most New COVID-19 Cases, Deaths.” Accessed May 1, 2020. https://www.beckershospitalreview.com/rankings-and-ratings/15-cities-with-the-most-new-covid-19-cases-deaths.html.
[18] A Tale of Two Countries: Sweden, Germany Take Different COVID-19 Approaches. Accessed May 1, 2020. https://www.youtube.com/watch?v=YyqRsOPo4Ik&feature=youtu.be.
[19] CalMatters. “Activists Want California to Ban Fracking. What Does Gov. Newsom Want?,” April 11, 2019. https://calmatters.org/environment/2019/04/activists-want-california-fracking-ban-newsom.
[20] Agency, Anadolu. “Hydraulic Fracking Sees Turkey Enter New Energy Era.” Daily Sabah, October 9, 2019. https://www.dailysabah.com/energy/2019/10/09/hydraulic-fracking-sees-turkey-enter-new-energy-era.
[21] Andrew Salmon. “Seoul to Send Destroyer to Strait of Hormuz.” Asia Times, January 21, 2020. https://asiatimes.com/2020/01/sth-korea-to-send-destroyer-to-straits-of-hormuz.
[22] “Az_motor_fuel_and_supply_distribution.Pdf.” Accessed May 1, 2020.
[23] “Belgium Covid Deaths – Google Search.” Accessed May 1, 2020.
[24] “Belgium Population – Google Search.” Accessed May 1, 2020.
[25] Reason.com. “Belgium’s Coronavirus Death Rate Surpasses Italy’s,” April 13, 2020. https://reason.com/2020/04/13/belgiums-coronavirus-death-rate-surpasses-italys.
[26] Life in Norway. “Black Gold: Norway’s Oil Story,” October 2, 2019.
[27] “Brazil Aiming to Double Its Oil Production.” Accessed May 1, 2020. https://www.rigzone.com/news/brazil_aiming_to_double_its_oil_production-29-nov-2019-160430-article.
[28] “Canada Coronavirus: 55,061 Cases and 3,391 Deaths – Worldometer.” Accessed May 1, 2020. https://www.worldometers.info/coronavirus/country/canada.
[29] Canada, Natural Resources. “Oil-Supply-Demand.” Natural Resources Canada, February 11, 2016. https://www.nrcan.gc.ca/our-natural-resources/energy-sources-distribution/clean-fossil-fuels/crude-oil/oil-supply-demand/18086.
[30] Correspondent, Caroline Enos Globe, Updated February 12, 2020, and 3:20 p m Email to a Friend Shared on Facebook and on Twitter. “Massachusetts Has 3rd Highest Number of Deaths from Out-of-State Air Pollution, Study Finds – The Boston Globe.” BostonGlobe.com. Accessed May 2, 2020.
[31] Ballotpedia. “Fracking in Michigan.” Accessed May 2, 2020. https://ballotpedia.org/Fracking_in_Michigan.
[32] “French State Blamed in Key Air Pollution Case.” BBC News, June 25, 2019, sec. Europe. https://www.bbc.com/news/world-europe-48762911.
[33] “Groningen Earthquake: Dutch Province Hit by Tremor Blamed on Decades of Gas Extraction | The Independent.” Accessed May 1, 2020.
[34] harvoa.org hypotheses and review of literature. “Harvoa.Org Hypotheses and Review of Literature: New York Measles 2019: Environment Omitted,” April 10, 2019. https://harvoa-med.blogspot.com/2019/04/measlesbrklyn.html.
[35] Hladky, Gregory B. “Connecticut’s Air Pollution Is among the Worst in the Eastern U.S., According to New Report.” courant.com. Accessed May 1, 2020. https://www.courant.com/news/connecticut/hc-news-bad-ct-air-quality-report-20190424-37tp7xx4b5c5lf3il6yzaybyya-story.html.
[36] “Hydraulic Fracturing by Country.” In Wikipedia, April 13, 2020. https://en.wikipedia.org/w/index.php?title=Hydraulic_fracturing_by_country&oldid=950790023.
[37] “What Are Spain’s Main Exports and Imports?” iContainers. https://www.icontainers.com/us/2020/01/21/spains-main-exports-and-imports.
[38] “Infected U.S. Shale Oil Is Being Turned Away by Asian Buyers.” Bloomberg.Com, March 27, 2019. https://www.bloomberg.com/news/articles/2019-03-27/infected-u-s-shale-oil-is-being-turned-away-by-asian-buyers.
[39] “International – U.S. Energy Information Administration (EIA).” Accessed May 1, 2020. https://www.eia.gov/international/analysis/country/ESP.
[40] “Japan Meteorological Agency | Overview of Japan’s Climate.” Accessed May 1, 2020. https://www.data.jma.go.jp/gmd/cpd/longfcst/en/tourist_japan.html.
[41] Statista. “Japan: Oil Imports by Country.” Accessed May 1, 2020. https://www.statista.com/statistics/761568/japan-crude-oil-import-by-country.
[42] nippon.com. “Japan Still Reliant on Middle Eastern Oil,” June 25, 2019. https://www.nippon.com/en/japan-data/h00482/japan-still-reliant-on-middle-eastern-oil.html.
[43] Krauss, Clifford. “Flood of Oil Is Coming, Complicating Efforts to Fight Global Warming.” The New York Times, November 3, 2019, sec. Business. https://www.nytimes.com/2019/11/03/business/energy-environment/oil-supply.html.
[44] Earthjustice. “Louisiana and Fracking,” April 8, 2011. https://earthjustice.org/features/louisiana-and-fracking.
[45] “Louisiana Fracking – Google Search.” Accessed May 1, 2020. https://www.google.com/search?q=louisiana+fracking&oq=louisiana+fracking
[46] Moens, Barbara. “Why Is Belgium’s Death Toll so High?” POLITICO. Accessed May 1, 2020. https://www.politico.com/news/2020/04/19/why-is-belgiums-death-toll-so-high-195778.
[47] Myers, Steven Lee. “China Experiences a Fracking Boom, and All the Problems That Go With It.” The New York Times, March 8, 2019, sec. World. https://www.nytimes.com/2019/03/08/world/asia/china-shale-gas-fracking.html.
[48] Nomads, World. “Air Pollution in Italy: Health Hazards to Be Aware Of.” Accessed May 1, 2020. https://www.worldnomads.com/travel-safety/europe/italy/pollution-other-health-hazards-in-italy.
[49] “Petroleum Industry in Iran.” In Wikipedia, April 5, 2020. https://en.wikipedia.org/w/index.php?title=Petroleum_industry_in_Iran.
[50] “Phoenix Covid Deaths – Google Search.” Accessed May 1, 2020.
[51] “Phoenix; Population – Google Search.” Accessed May 1, 2020.
[52] “Population Density per Square Mile of Countries.” Accessed May 1, 2020. https://www.infoplease.com/world/population-statistics/population-density-square-mile-countries.
[53] project, The World Air Quality Index. “Philadelphia Air Pollution: Real-Time Air Quality Index.” aqicn.org. Accessed May 1, 2020. https://aqicn.org/city/philadelphia/.
[54] Rapoza, Kenneth. “Putin: ‘We’ll Never Frack.’” Forbes. Accessed May 1, 2020. https://www.forbes.com/sites/kenrapoza/2019/11/20/putin-well-never-frack.
[55] “Russia Exports Most of Its Crude Oil Production, Mainly to Europe – Today in Energy – U.S. Energy Information Administration (EIA).” Accessed May 1, 2020. https://www.eia.gov/todayinenergy/detail.php?id=33732.
[56] Seth, Shobhit. “Countries With the Highest Fracking Potential.” Accessed May 1, 2020. https://www.investopedia.com/articles/investing/091614/countries-highest-fracking-potential.asp.
[57] “S.Korean Refiners Reject U.S. Oil Cargoes, but Will Keep Trade Going.” Reuters, March 29, 2019. https://www.reuters.com/article/southkorea-crude-usa-idUSL3N21F27V.
[58] “South Korea Imports No Oil from Iran in June; First-Half Imports Fall 37%.” Reuters, July 15, 2019. https://www.reuters.com/article/us-southkorea-oil-iran-idUSKCN1UA01Z.
[59] “South Korea Naval Unit to Expand Operations to Strait of Hormuz | Voice of America – English.” Accessed May 1, 2020. https://www.voanews.com/east-asia-pacific/south-korea-naval-unit-expand-operations-strait-hormuz.
[60] “Sweden Strikes Own Oil, Yet Prefers to Import Russian Fuel.” Accessed May 1, 2020. https://sputniknews.com/business/201703071051330296-sweden-oil-russia.
[61] OZY. “The Dirty Secret Behind Norway’s ‘Green’ Economy,” May 9, 2018. https://www.ozy.com/around-the-world/the-dirty-secret-behind-norways-green-economy/86604.
[62] “These Are the 55 Most Polluted Towns in Italy – The Local.” Accessed May 1, 2020. https://www.thelocal.it/20190122/these-are-the-55-most-polluted-towns-in-italy.
[63] Times, The New York. “Coronavirus in the U.S.: Latest Map and Case Count.” The New York Times, sec. U.S. Accessed May 1, 2020. https://www.nytimes.com/interactive/2020/us/coronavirus-us-cases.html.
[64] “Turkey Covid Deaths – Google Search.” Accessed May 1, 2020. https://www.google.com/search?q=turkey+covid+deaths&oq=turkey.
[65] “Turkey: Population – Google Search.” Accessed May 1, 2020. https://www.google.com/search?q=turkey%3A+population&oq=turkey%3A+population.
[66] “UK: Oil and Gas Imports, by Country.” Accessed May 1, 2020. https://www.statista.com/statistics/381963/crude-oil-and-natural-gas-import-origin-countries-to-united-kingdom-uk.
[67] Energuide. “Where Does the Electricity and the Gas Used in Belgium Come From?” Accessed May 1, 2020. https://www.energuide.be/en/questions-answers/where-does-the-electricity-and-the-gas-used-in-belgium-come-from/4.
[68] NPR.org. “Why Belgium’s Death Rate Is So High: It Counts Lots Of Suspected COVID-19 Cases.” Accessed May 1, 2020. https://www.npr.org/sections/coronavirus-live-updates/2020/04/22/841005901/why-belgiums-death-rate-is-so-high-it-counts-lots-of-suspected-covid-19-cases.
[69] “WWF-Fossil-Fuels-Final-Report” Accessed May 1, 2020. https://wwf.be/assets/IMAGES-2/CAMPAGNES/ELECTIONS2019/FF-report/WWF-fossil-fuels-final-report.pdf.
[70] “Turkey Covid Deaths – Google Search.” Accessed May 1, 2020. https://www.google.com/search?q=turkey+covid+deaths&oq=turkey&aqs=chrome.0.69i59j69i57j69i61.1311j0j7&sourceid=chrome&ie=UTF-8.
[71] “Turkey: Population – Google Search.” Accessed May 1, 2020. https://www.google.com/search?q=turkey%3A+population&oq=turkey%3A+population&aqs=chrome..69i57j69i58.3727j0j7&sourceid=chrome&ie=UTF-8.
[72] Morudu, Palesa. “Opinion | This Is South Africa’s Third Major Pandemic in 100 Years. It Has Learned Its Lessons.” Washington Post. Accessed May 2, 2020. https://www.washingtonpost.com/opinions/2020/05/01/this-is-south-africas-third-major-pandemic-100-years-it-has-learned-its-lessons/.
[73] Nordling, Apr. 15, Linda, 2020, and 10:45 Am. “South Africa Flattens Its Coronavirus Curve—and Considers How to Ease Restrictions.” Science | AAAS, April 15, 2020. https://www.sciencemag.org/news/2020/04/south-africa-flattens-its-coronavirus-curve-and-considers-how-ease-restrictions.
[74] South African Market Insights. “South Africa’s Crude Oil Imports.” Accessed May 2, 2020. https://www.SouthAfricanMI.com/blog-23oct2017.html.
[75] Magee, Caitlin. “Is African Fracking to Receive an Injection of Investment?” SciTech Europa (blog), January 6, 2020. https://www.scitecheuropa.eu/is-african-fracking-to-receive-an-injection-of-investments/99076/.
[76] Ballotpedia. “Fracking in Michigan.” Accessed May 2, 2020. https://ballotpedia.org/Fracking_in_Michigan.
[77] Correspondent, Caroline Enos Globe, Updated February 12, 2020, and 3:20 p m Email to a Friend Share on Facebook Share on TwitterPrint this Article View Comments15. “Massachusetts Has 3rd Highest Number of Deaths from Out-of-State Air Pollution, Study Finds – The Boston Globe.” BostonGlobe.com. Accessed May 2, 2020. https://www.bostonglobe.com/2020/02/12/metro/massachusetts-has-3rd-highest-number-deaths-out-of-state-air-pollution-study-finds/.
[78] Fortune. “China Is Guzzling Crude Oil. Where Is It All Coming From?” Accessed May 2, 2020. https://fortune.com/longform/china-crude-oil-consumption-map/.
[79] Hou, Zhenbo, Dean Granoff, Ilmi Granoff, Jodie Keane, Jane Kennan, and Andrew Norton. “The Development Implications of the Fracking Revolution,” n.d., 42.
[80] Myers, Steven Lee. “China Experiences a Fracking Boom, and All the Problems That Go With It.” The New York Times, March 8, 2019, sec. World. https://www.nytimes.com/2019/03/08/world/asia/china-shale-gas-fracking.html.
[81] World’s Top Exports. “Top 15 Crude Oil Suppliers to China,” April 26, 2020. http://www.worldstopexports.com/top-15-crude-oil-suppliers-to-china/.
[82] Troush, Sergei. “China’s Changing Oil Strategy and Its Foreign Policy Implications.” Brookings (blog), November 30, 1AD. https://www.brookings.edu/articles/chinas-changing-oil-strategy-and-its-foreign-policy-implications/.
Symptoms
[83] Amy McKeever. “Inflamed Brains, Toe Rashes, Strokes: Why COVID-19’s Weirdest Symptoms Are Only Emerging Now,” May 21, 2020. https://www.nationalgeographic.com/science/2020/05/kawasaki-stroke-why-coronavirus-weirdest-symptoms-are-only-emerging-now-cvd/?cmpid=org=ngp::mc=crm-email::src=ngp::cmp=editorial::add=SpecialEdition_20200522
[84] ATSDR. “Medical Management Guidelines (MMGs): Hydrogen Cyanide (HCN).” Accessed May 11, 2020. https://www.atsdr.cdc.gov/MMG/MMG.asp?id=1141&tid=249.
[85] Aylin Woodward. “Coronavirus Shows Doctors How a Virus Can Cause Strokes and Blood Clots – Business Insider,” May 3, 2020. https://www.businessinsider.com/coronavirus-causes-strokes-inflammation-in-blood-vessels-clots-2020-4.
[86] CDC – MMWR. “The Emergency Response Safety and Health Database: Systemic Agent: HYDROGEN CYANIDE (AC) – NIOSH,” September 27, 2018. https://www.cdc.gov/niosh/ershdb/emergencyresponsecard_29750038.html.
[87] Claire Jarvis. “The Unusual Symptoms of COVID-19.” The Scientist Magazine®, May 7, 2020. https://www.the-scientist.com/news-opinion/the-unusual-symptoms-of-covid-19-67522.
[88] “Cyanide Poisoning.” In Wikipedia, April 19, 2020. https://en.wikipedia.org/w/index.php?title=Cyanide_poisoning&oldid=951938589.
[89] EPA. “Toxicological Review of Hydroge Cyanide and Cyanide Salts,” September 2010. https://cfpub.epa.gov/ncea/iris/iris_documents/documents/toxreviews/0060tr.pdf.
[90] Matsuoka, Yoshinori, Mitsuhiro Yasuda, and Makoto Hashizume. “Lung Injury and Renal Failure Caused by Potassium Cyanide Poisoning.” BMJ Case Reports 2009 (December 9, 2009). https://doi.org/10.1136/bcr.04.2009.1768.
[91] N.V. Bhagavan. “Cyanide Poisoning,” 2015. https://www.sciencedirect.com/topics/neuroscience/cyanide-poisoning.
[92] Stacy Kish. “Sick with COVID-19? Watch for Fever Shakes, Called Rigors,” April 7, 2020. https://uofuhealth.utah.edu/newsroom/news/2020/04/fever-covid19.php.
Politics
[93] Guzman, Joseph. “Fauci Says Second Wave of Coronavirus Is ‘Inevitable.’” Text. The Hill, April 29, 2020. https://thehill.com/changing-america/resilience/natural-disasters/495211-fauci-says-second-wave-of-coronavirus-is.

[94] NBC News. “Trump Calls Coronavirus Democrats’ ‘New Hoax.’’ Accessed May 5, 2020. https://www.nbcnews.com/politics/donald-trump/trump-calls-coronavirus-democrats-new-hoax-n1145721
Viruses, Vaccines and Infectious Disease
[95]
[96] Young RO, Migalko G (2020) What Causes Oxygen Deprivation of the Blood(DIC) and Then Lungs(SARS – CoV 2 & 12)?. Integ Mol Bio Biotechnol 1: 001-007.
[97] Young, R.O., Migalko, G, “Interstitial Fluid Lung Disease (IFLD) of the Interstitium Organ the Cause and Self-Care to a Self-Cure for Lung Disease,” International Journal of Cancer Research & Therpay, January, 2020.
[98] Young RO (2016) Second Thoughts about Viruses, Vaccines, and the HIV/AIDS Hypothesis – Part 1. Int J Vaccines Vaccin 2(3): 00032. DOI: 10.15406/ijvv.2016.02.00032
[99] Young RO (2016) Second Thoughts Concerning Viruses, Vaccines and the HIV/AIDS Hypothesis – Part 2. Int J Vaccines Vaccin 2(3): 00034. DOI: 10.15406/ijvv.2016.02.00034
[100] Young RO (2016) Second Thoughts Concerning Viruses, Vaccines and the HIV/AIDS Hypothesis – Part 3 HIV/AIDS and the Monomorphic Disease Model. Int J Vaccines Vaccin 2(3): 00035. DOI: 10.15406/ijvv.2016.02.00035
[101] Young RO, The Dismantling of the Viral Theory, Journal of Infectious Diseases and Therapy, Volume 6, DOI: 10.4172/2332-0877-C7-055. December 5, 2018 https://www.drrobertyoung.com/post/dismantling-the-viral-theory